SERIALFLOW / ANDROID
Turn an Android phone into an ESP32 serial monitor with USB OTG. Capture boot logs, filter errors, send commands, decode ESP output, and graph data in SerialFlow.
How to Debug ESP32 from Android with SerialFlow
Flashing firmware is only half of an ESP32 workflow. The next questions usually appear after the board restarts: Did it join Wi-Fi? Why did MQTT disconnect? What happened before the watchdog reset? Is the sensor value noisy or actually drifting?
A laptop is useful, but it is not always nearby. With an Android phone, a USB OTG adapter, and SerialFlow, you can carry a practical ESP32 serial monitor in your pocket. SerialFlow connects directly to a board over USB, keeps fast-moving logs manageable, and lets you send commands back without moving the project to a desk.
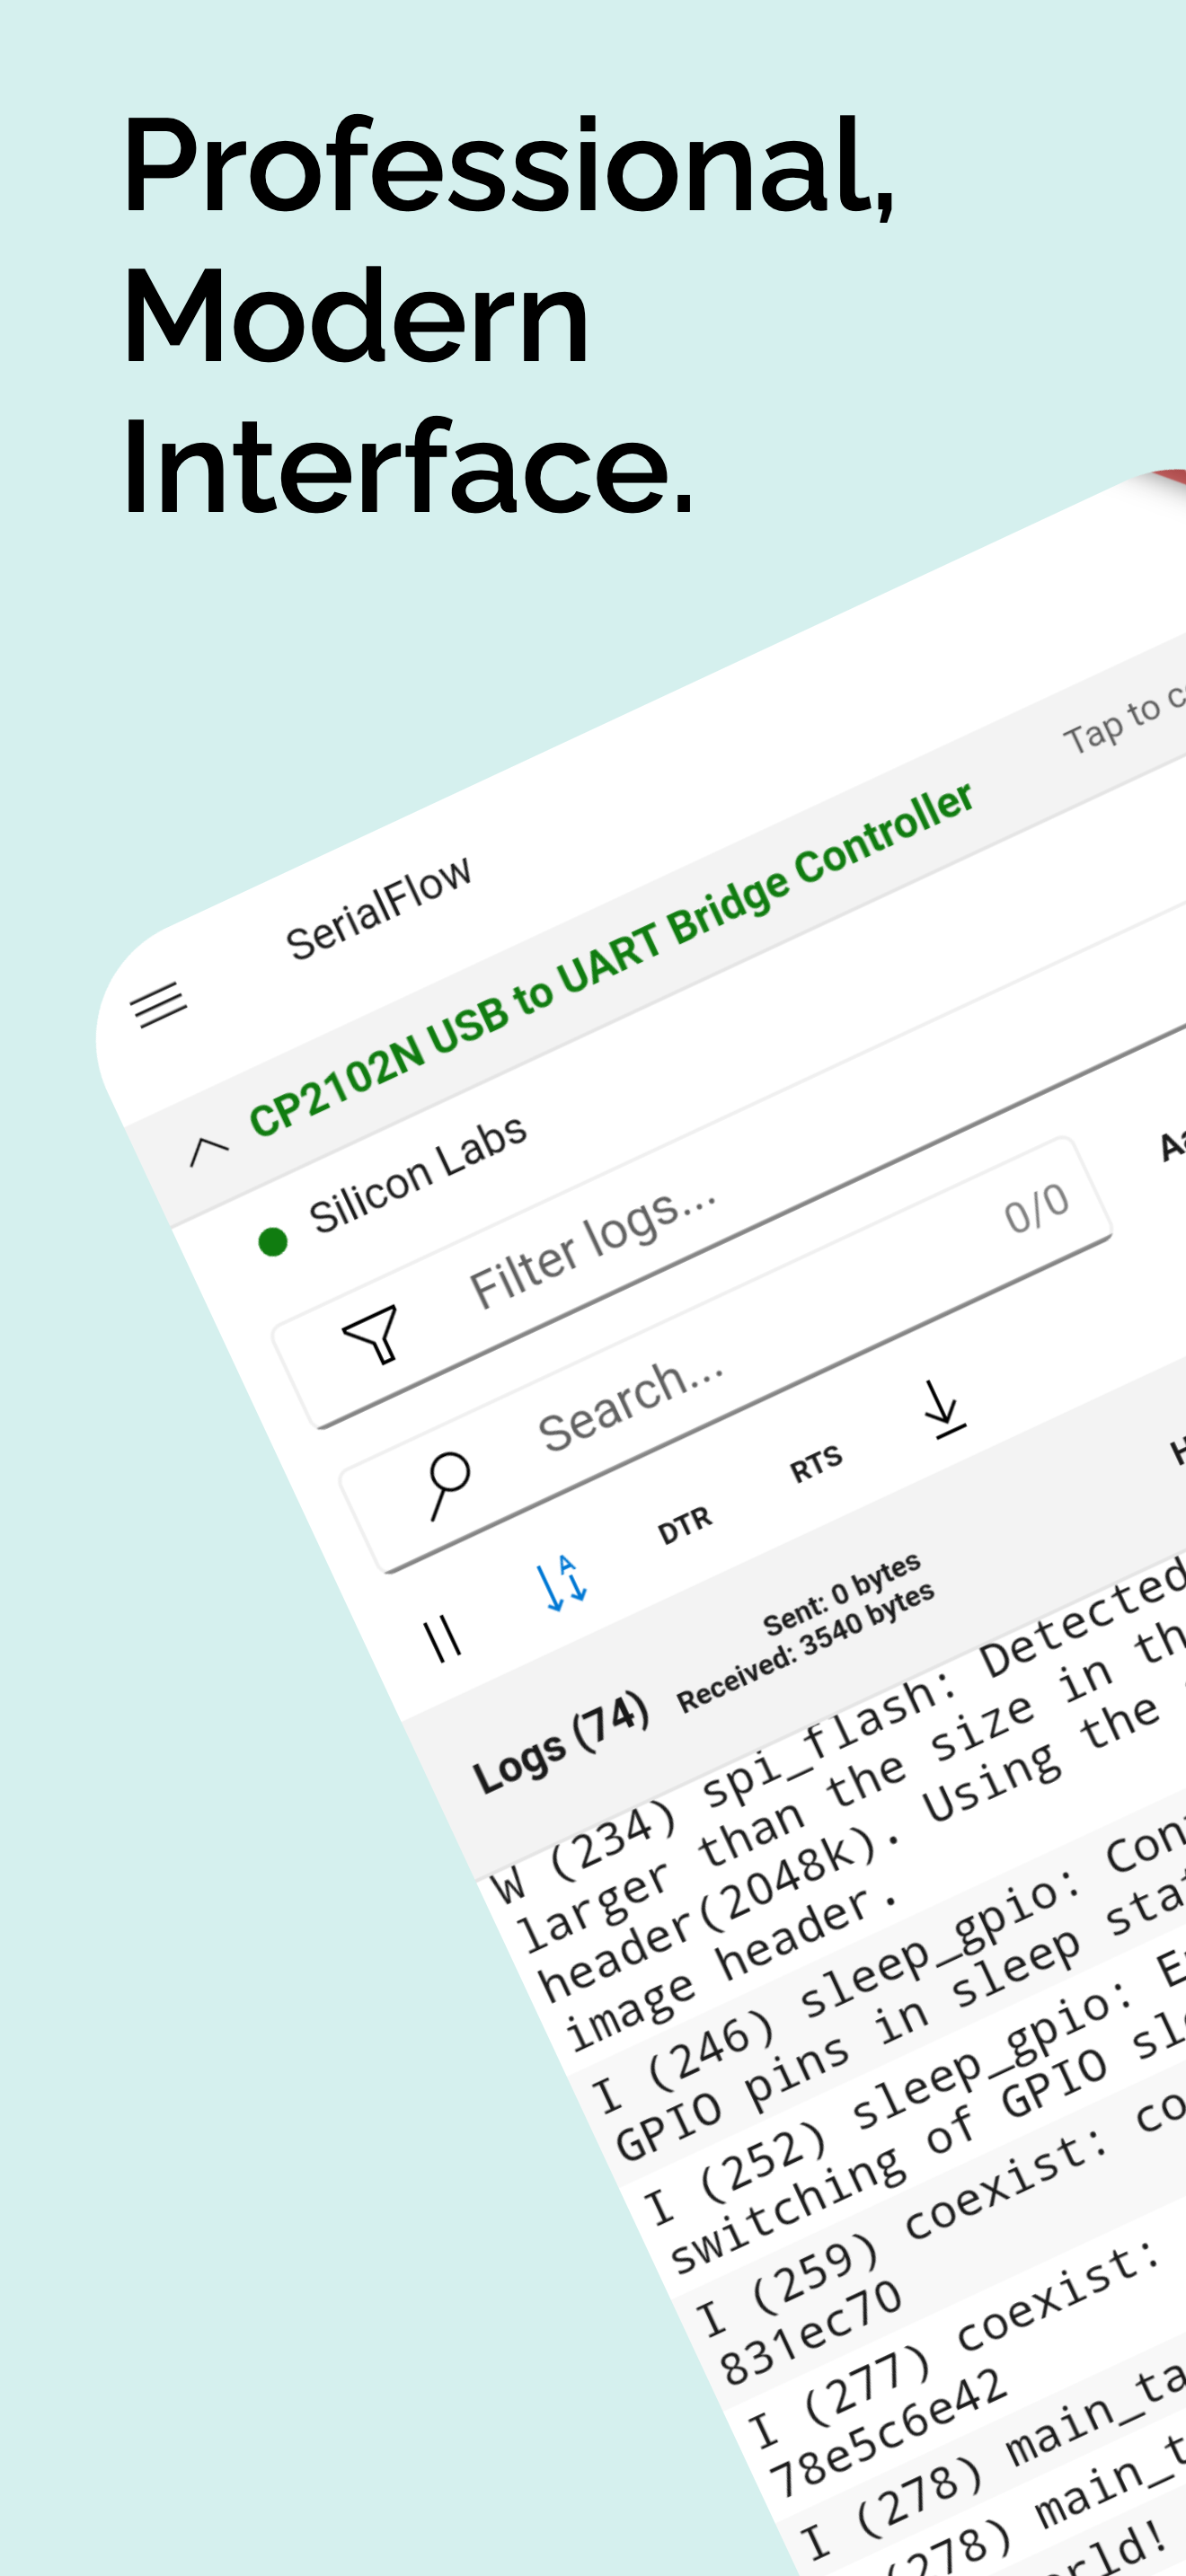
What SerialFlow adds after flashing
ESPFlash handles the firmware deployment step. SerialFlow takes over once the new firmware is running.
The Android app is designed around the work that starts after a successful flash:
- Open a USB serial connection through Android USB host/OTG.
- Configure baud rate, data bits, stop bits, parity, DTR, and RTS.
- Pause output, control auto-scroll, clear the terminal, and share or export captured logs.
- Search with previous/next navigation, case-sensitive matching, or regular expressions.
- Combine multiple filter rules to isolate useful messages from noisy output.
- Send text or hexadecimal data with the required line ending.
- Save repeated requests as quick commands.
- Decode ESP-oriented logs and inspect numeric telemetry as a live chart.
That makes SerialFlow more than a scrolling text window. It is a compact debugging workspace for ESP32, ESP8266, STM32, Arduino-compatible boards, and other devices that expose a USB serial interface recognized by Android.
A phone-only ESP32 workflow
1. Flash the firmware
Use ESPFlash to write the firmware from Android. The detailed process is covered in How to Flash ESP32 from Android via USB OTG.
When flashing finishes, disconnect inside ESPFlash or close the flashing session. Only one app can normally own the USB serial device at a time, so the port must be released before SerialFlow opens it.
2. Connect the board to SerialFlow
Keep the board attached through a data-capable USB cable and an OTG adapter when one is required. Open SerialFlow, select the detected USB device, and approve Android’s USB permission prompt.
If the board does not appear, reconnect it after SerialFlow is open. A charge-only cable is a common reason for an empty device list.
3. Match the serial settings
Choose the same serial configuration used by the firmware:
- Baud rate: 115200 is common for ESP32 projects, but the firmware setting is authoritative.
- Data bits: commonly 8.
- Stop bits: commonly 1.
- Parity: commonly none.
- DTR/RTS: leave unchanged unless the board or reset circuit requires them.
Readable text confirms that the most important settings match. Repeating symbols or corrupted characters usually point to the wrong baud rate, data bits, parity, or stop bits.
4. Capture the boot sequence
Reset or power-cycle the board while the terminal is connected. The earliest lines often contain the best evidence for boot loops, partition problems, configuration failures, or crashes.
Keep auto-scroll enabled while reproducing the problem. Pause the stream when the failure appears so the relevant lines stop moving. You can then search, filter, copy, or export the evidence without losing your place.
5. Search and filter the signal from the noise
A busy ESP32 can print network state, sensor samples, scheduler messages, and application logs several times per second. SerialFlow provides two complementary tools:
- Search locates a term and moves between previous and next matches. Case sensitivity and regular expressions help when plain text is not enough.
- Filters continuously narrow the visible stream. Multiple rules can be combined to keep related subsystems together.
For a Wi-Fi and MQTT problem, start with terms such as wifi, mqtt, disconnect, and error. A regular expression like the following catches several common fatal paths:
(Guru Meditation|panic|assert|watchdog)Filtering changes what you inspect; it does not require changing the firmware or recompiling a special diagnostic build.
6. Send commands back to the firmware
Interactive firmware often exposes a small serial console. SerialFlow can send normal text, raw hexadecimal bytes, and configurable line endings. If a command appears to do nothing, verify whether the parser expects LF, CR, CRLF, or no suffix.
For example, enter status, choose the line ending expected by the firmware, and send it. Save frequently used operations such as status, reboot, wifi scan, or a protocol frame as quick commands so they remain one tap away during repeated tests.
7. Decode logs or graph telemetry
Raw output is not always the clearest representation.
Use the ESP log decoder when you want structured ESP-oriented log output rather than one undifferentiated stream. When the firmware prints numeric telemetry in a stable format, open the chart view to watch values change over time. A waveform can reveal spikes, oscillation, drift, and timing patterns that are easy to miss in rows of numbers.
This is especially useful while tuning sensors, motor control, power measurements, temperature regulation, or any loop that emits periodic values.
8. Export a reproducible bug report
Once the failure has been captured, pause the terminal and share or export the log. Include the firmware version, board model, serial settings, and the exact action that triggered the problem.
A short, filtered trace with those details is usually more useful than a screenshot of hundreds of unrelated lines.
Practical example: diagnose an ESP32 that drops MQTT
Suppose a device connects correctly after flashing but loses its broker connection a few minutes later.
- Flash the candidate build with ESPFlash and release the USB connection.
- Open the board in SerialFlow at the firmware’s serial settings.
- Reset the board and capture the complete boot sequence.
- Add filters for
wifi,mqtt,heap,error, andwatchdog. - Search with
(disconnect|timeout|panic|assert)and move through each match. - Send
statuswith the expected line ending to request the current state. - Pause and export the trace immediately after the disconnect.
The resulting log gives you a timeline: network association, broker connection, memory state, the failure message, and any reset reason. That is far more actionable than knowing only that “the device went offline.”
Troubleshooting Android USB serial connections
| Symptom | What to check |
|---|---|
| No USB device appears | Confirm the phone supports USB host/OTG, use a data cable, reconnect the board, and approve the Android USB permission. |
| The port is busy after flashing | Disconnect or close ESPFlash, then reconnect the USB device before opening it in SerialFlow. |
| Output is unreadable | Match baud rate, data bits, stop bits, and parity to the firmware. |
| The terminal is connected but empty | Reset the board, confirm the selected USB interface, and verify that the firmware actually writes logs to that port. |
| The board resets or disconnects | Check cable quality and power stability; also review DTR/RTS behavior for the board. |
| Sent commands receive no response | Confirm text versus hex mode and use the line ending expected by the command parser. |
Carry the flash-and-debug loop with you
ESPFlash and SerialFlow cover two different parts of the same Android workflow: install firmware, then understand what that firmware is doing.
Open the SerialFlow product page to review the Android terminal features, or install SerialFlow from Google Play. For the deployment side of the loop, ESPFlash is also available on Google Play.